
An Introduction to Business Intelligence (BI) Dashboard in the Rail Industry
Today, data plays a fundamental role in the major decisions of organizations. Rail transportation companies, due to the high volume of financial transactions and ticket sales, require Business Intelligence (BI) systems to monitor their performance and adopt optimal strategies for the future through data analysis. The project Business Intelligence Dashboard of Rail Seir Kowsar Company was designed and implemented with this aim to create more transparency and agility in managing sales and rail services.
Introducing the Business Intelligence Dashboard Project of Rail Seir Kowsar
Rail Seir Kowsar Company, as one of the active players in the rail transportation sector, has placed the Reporting and Business Intelligence Dashboard Panel project on its agenda. The aim of this project is to collect and analyze sales and advance ticket sales data, categorize information by tariffs, origins, and travel destinations, and present them in the form of management dashboards.
Challenges Before Project Implementation
- Lack of comprehensive and integrated reports on real-time ticket sales
- Inability to quickly compare sales based on tariffs and routes
- Heavy reliance on manual and time-consuming reports
- Lack of suitable tools for real-time monitoring of sales performance
Key Objectives of the Project
- Creating a Business Intelligence Management Dashboard for the company's managers
- Seeing the sales amount of each trip by time and date
- Analyzing the advance sales of each trip and comparing it with actual sales
- Reporting sales based on tariffs and rail routes
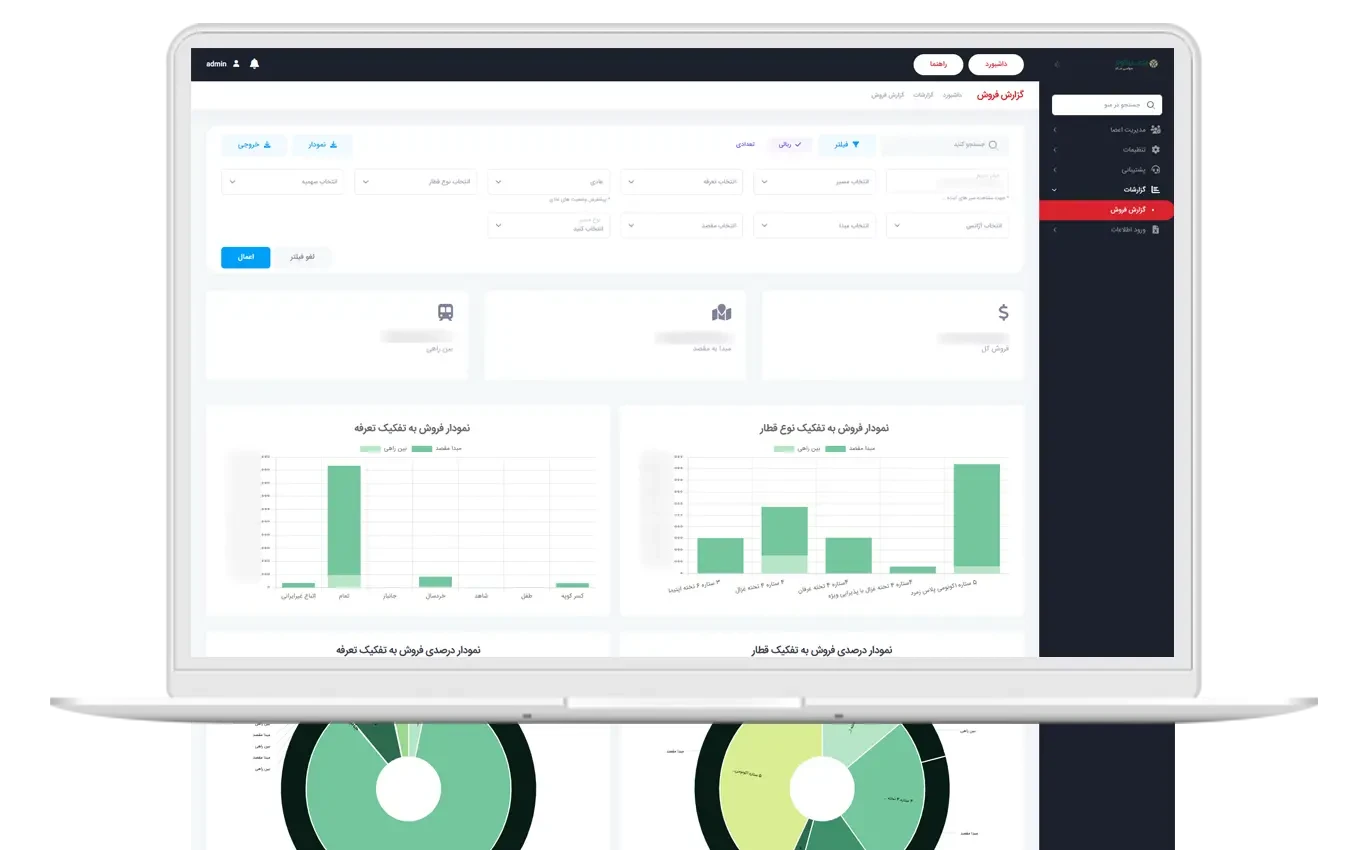
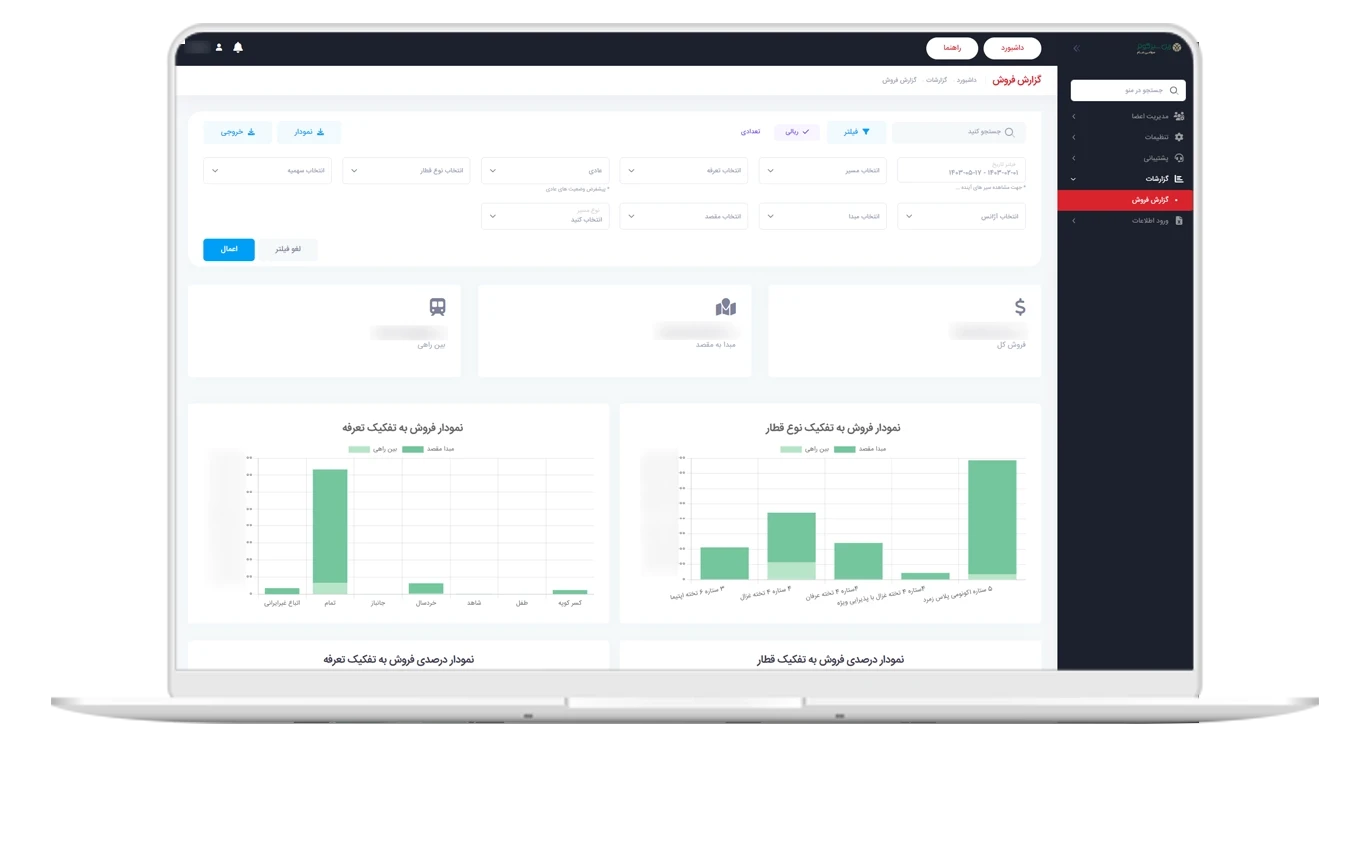
Modules and Features of the Business Intelligence Dashboard
1. Sales Report for Each Trip
This module displays the precise sales statistics for tickets of each train (trip) on a daily and periodic basis. Managers can assess the status of each trip separately and identify high-demand routes.
2. Advance Sales Report for Each Trip
In this section, advance ticket sales statistics are displayed, and managers can examine the ratio of advance sales to final sales. This information helps in making more accurate fleet capacity planning.
3. Sales Report by Tariffs
This module allows viewing ticket sales based on various tariffs (special, regular, discounted, etc.). Managers can assess each tariff's share of total sales and formulate new pricing policies.
4. Sales Report by Origin and Destination
One of the key aspects of the project is providing detailed reports based on origin and destination routes. These reports assist managers in identifying high-demand and low-demand routes and optimize train operation planning.
Achievements of the Business Intelligence Dashboard Project
Sales Performance Transparency
The BI dashboard enables real-time sales monitoring and brings transparency to managerial decision-making.
Reduction in Reporting Time
Reports that previously took several hours are now automatically generated in a few seconds.
Smarter Decision Making
Using analytical data, managers were able to optimize their sales and pricing policies.
Increased Fleet Productivity
By analyzing high-demand routes, resource allocation for the fleet became more optimized, leading to increased company revenue.
Conclusion
The Business Intelligence Dashboard of Rail Seir Kowsar Company was able to transform the ticket sales decision-making process by creating a transparent and analytical platform. This dashboard is a successful example of the application of Business Intelligence in the Iranian rail industry and can serve as a model for other rail transportation companies.
Frequently Asked Questions (FAQ)
1. What is the purpose of the Rail Seir Kowsar Business Intelligence Dashboard?
This dashboard is designed for monitoring and analyzing ticket sales and advance sales by route, tariff, and time.
2. What benefits does it provide for managers?
Managers can receive comprehensive sales reports in the shortest time and make more accurate strategic decisions.
3. Is it possible to compare sales based on tariffs?
Yes, this system displays ticket sales based on various tariffs.
4. Are high-demand routes identified?
Yes, the origin-destination reports help easily identify high and low sales routes.
5. What impact does this dashboard have on productivity?
By clarifying data, fleet allocation has become more optimized, resulting in increased company productivity and profitability.
6. Can this project be implemented in other companies as well?
Yes, this dashboard is customizable and can be used in rail companies and even other service industries.